2017 Tennessee Trade-Weighted Dollar Index 1st Quarter 2017
Tables and Graphs
Prices matter. The more expensive a product, the less competitive it is (all other things being equal, of course!). So when a country's prices go up, its exports should fall. Foreign exchange rate indices were developed to measure this. When an index rises, that country's prices are increasing relative to its competitors. We should expect this to be a drag on the ability of the country's exporters to sell goods in other markets.
These indices are typically weighted. That means the index reflects the relative market size of its trade partners. If 50 percent of trade goes to a certain market, that market has a 50 percent weight in the trade index. There are a number of trade-weighted indexes (including one by the Federal Reserve) that report the competitiveness of American exporters based upon the global value of the dollar. For the past two decades, we at Global Commerce have maintained an index specifically for Tennessee and its exporters. Because Tennessee does not export to the same markets with the same intensity as exporters from other states, a state index provides a superior picture of the environment our exporters are facing.
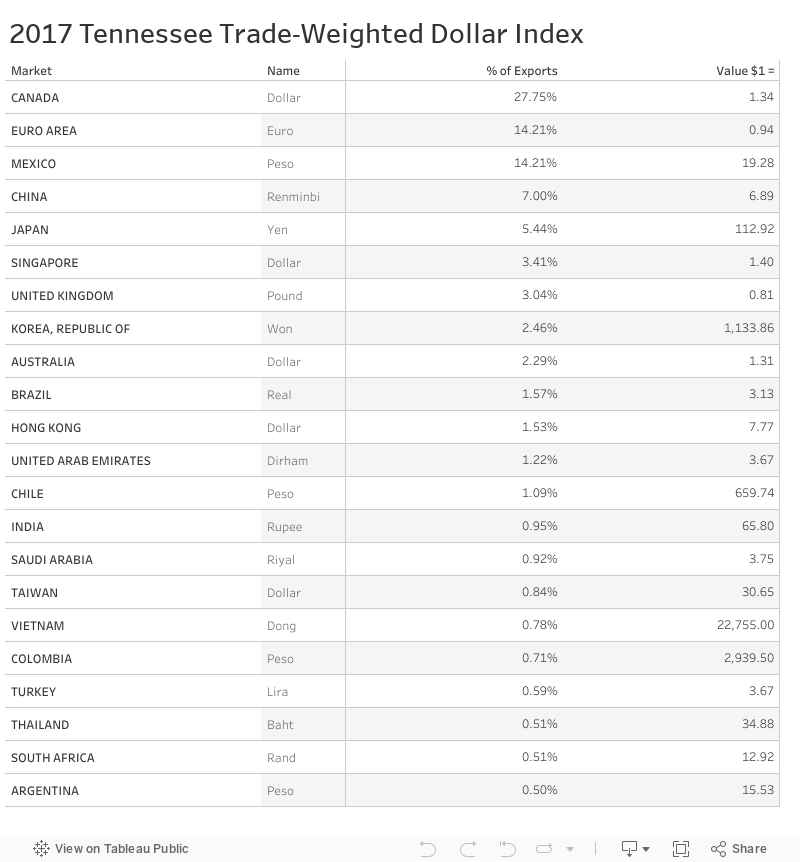
Markets and exporters change over time, of course, so we periodically update the index. We have revised the index for 2017. The new index includes the state's top 23 markets (as denoted by a shared currency). Together these markets account for more than 92 percent of the state's exports. The individual markets and their sizes are shown in our graphic.
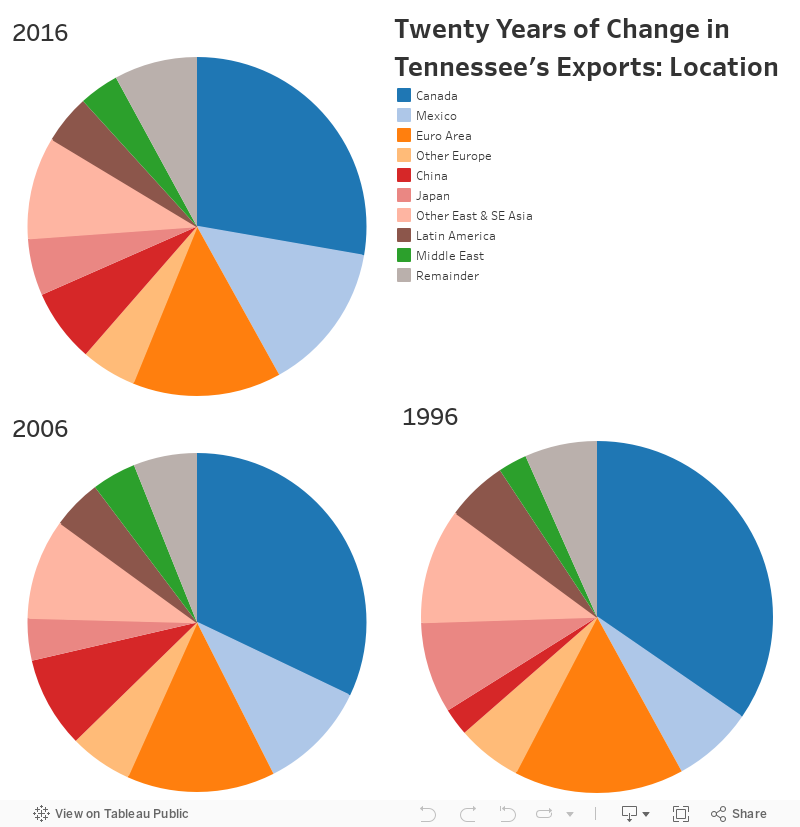
It is interesting to look at the changes since our first index in 1996. Perhaps surprisingly, the destination of the state's foreign shipments has not altered dramatically over that period. In fact, most countries and regions are roughly the same market size now as they were 20 years ago. We might note three facts, however. Though North America remains by far the largest market, and though its total relative size has not altered substantially, we can see a significant rotation of exports from Canada to Mexico. Twenty years ago the Canadian market took 35 percent of the state's exports; today that has declined to 27 percent. Meanwhile, the share going to Mexico has doubled from 7.5 percent to 14 percent over this period.
The second fact is the steady growth of exports to China. Counter to popular belief, the increase of exports to China has not been jaw-dropping, but it has been steady. Tennessee exports to China have nearly tripled over the past two decades. Over that time, China has become the state's third-largest market, taking about 6 percent of Tennessee's foreign shipments. The third fact is not a change but a lack of change. Despite what is sometimes reported, the Euro area remains a huge market for Tennessee. It has dropped by less than 2 percent over 20 years. If we add the U.K. and the other European nations that do not use the Euro, one-fifth of all state exports still go to the "old continent."
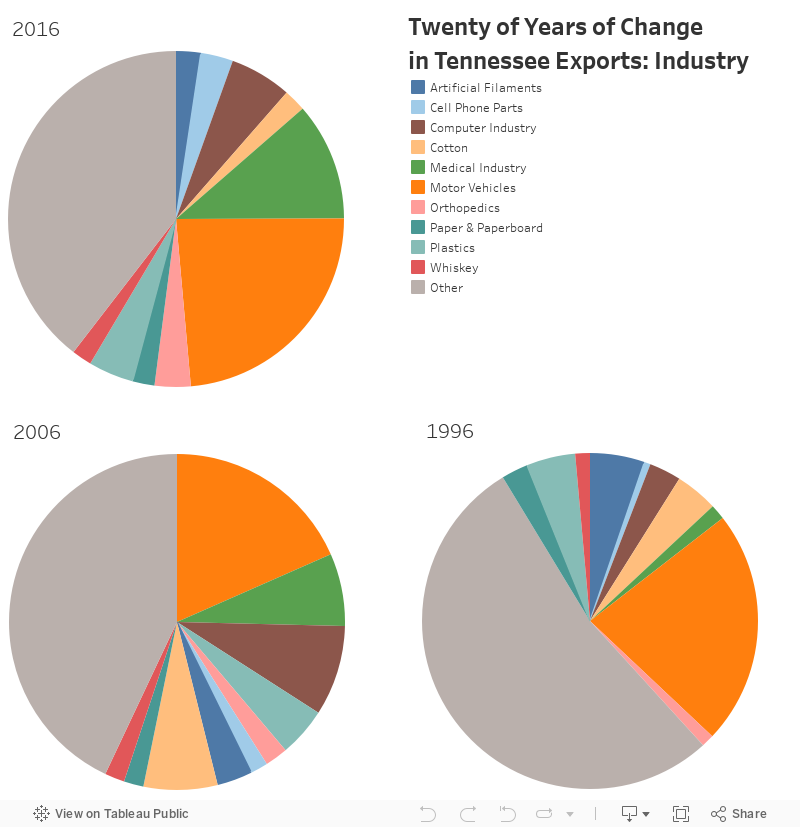
If we switch to examining industries, we again find little dramatic change.* However, there has been a clear concentration in state exporting. The top-10 industry groups in Tennessee accounted for less than half of all state exports in 1996 (47 percent) but slightly over 60 percent in 2016. No major export industry has substantially declined over that period. (Apparels, the most likely suspect, were already in severe decline by the mid-90s.) But three industries have climbed steadily. The most significant is the medical industry. Twenty years ago it accounted for less than 2 percent of state exports. Today that figure is over 11 percent. Orthopedics, which some might consider a sister industry to medicine, has also grown from about 1 percent to 3.5 percent over this period. The third rising exporter is the cellular phone/wireless industry, which also produced about 3.5 percent of all Tennessee exports last year. None of these industries, though, can rival the state's continuing concentration in automotive exports.
The past 20 years of Tennessee export activity have thus been more a time of "steady as she goes" than an era of great surges and declines. That's probably not a bad thing!
We calculate industries by aggregating HS codes of all materials that are identified with that industry. So, for example, automotive glass exports are usually counted in the glass industry or sector, but we have placed them in the automotive industry.

