Tennessee Trade Before and After the Global Crash 3rd Quarter 2015
Tables and Graphs
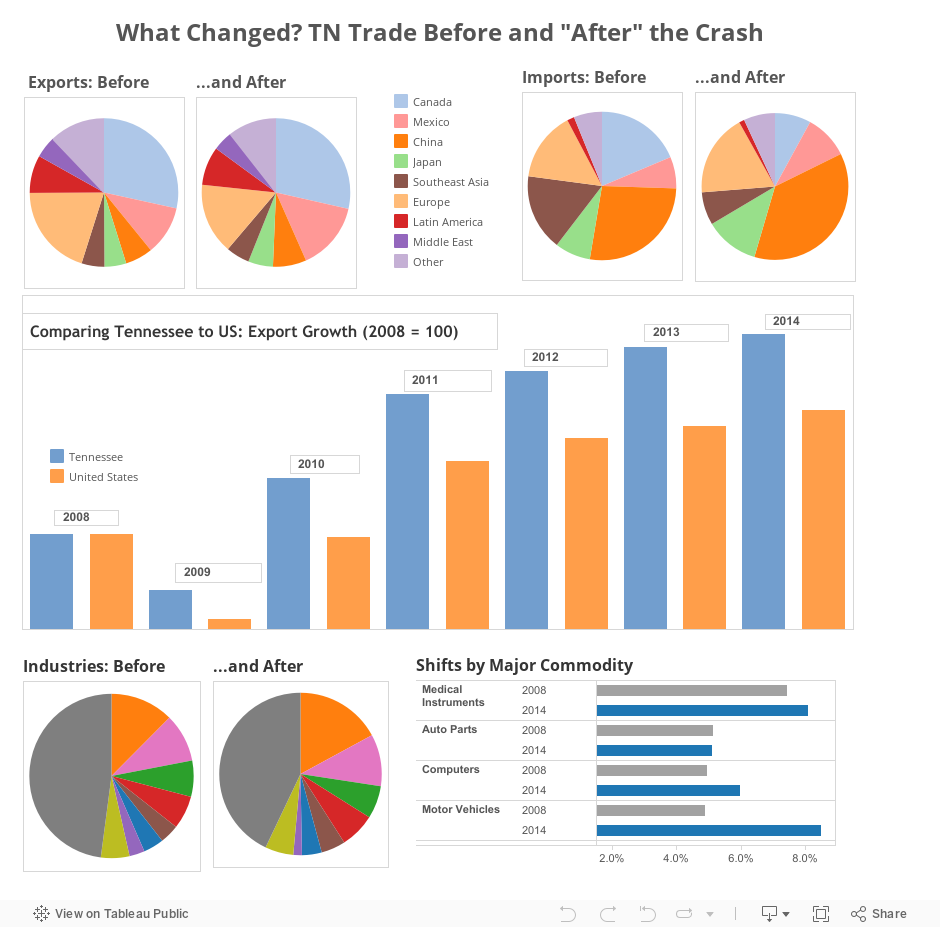
The crash turned out to be more of an interruption of longer-term trends than a remaking of the state’s export picture.
The global economic crisis of 2008 was a disaster for world trade. In Tennessee, exports dropped by 12 percent (almost $3 billion) between 2008 and 2009, the largest decline on record. Fortunately, exports again picked up. By 2014 Tennessee exports were 60 percent higher than the 2009 bottom (though they did not double over that period, as President Obama had wished). But how had they changed? How does the state’s export picture differ from that before the crash?
As noted, state exporters staged a major comeback after 2009, adding an additional $12 billion in foreign sales by 2014. (Regrettably, things stalled in 2015.) In fact, the state bounced back more rapidly than did the rest of the country. Tennessee exports have grown 14 percent more than have U.S. exports over the past five years.
The major change has been the relative decline of Europe. In 2008, just over one-fifth of all state exports went to the E.U. Today, that has fallen to 15.5 percent. A major reason has been a steep fall in shipments to the U.K. Great Britain is one of the few markets where exports today remain below where they were in 2008 (and not trivially; they are down 10 percent). East Asia, on the other hand, has increased its share of Tennessee exports by about 10 percent, but perhaps surprisingly Mexico has proven the most dynamic market. About 15 percent of all state exports now go south of the border, a one-third increase from 2008. In other words, Mexico today is the recipient of just about as many Tennessee exports as the entire E.U.! A longer-term trend is the increasing geographical concentration of state exports. NAFTA, East Asia, and the E.U. now account for nearly three-fourths of Tennessee’s foreign shipments.
There have been far greater shifts in the origin of the state’s imports. As one might anticipate, the share of imports from China has greatly increased. Today more than one-third of the state’s imports come from China, a quarter more than in 2008. This has mostly been at the expense of Southeast Asian countries, however. Their portion of state imports fell by more than 50 percent, to just a little over 7 percent of Tennessee’s total. State imports have also shifted heavily away from Canada. In 2008, imports from Canada were two-thirds the amount coming in from China, but by 2014, they had dropped to only one-quarter. Besides China, the two growing import sources over the period have been Japan and Mexico.
As for the exports themselves, the biggest change since the crash is the large increase in automotive exports. At the commodity (NAICs Code) level, the share of automotive goods in Tennessee’s exports has grown substantially. About one of every six dollars in state exports is now in the automotive sector, a third higher than it was in 2008. Most of this increase is in the shipment of cars themselves, in large part the result of the development of global platforms by Nissan and Volkswagen. Of the state’s larger export sectors, only cotton suffered a significant decline in export share. In fact, the major trend has been toward a concentration of exports. The top eight export industries now account for nearly 57 percent of Tennessee’s foreign shipments.
Taking a somewhat finer-grained look at exports using commodity (HS) data, we get a better sense of where the auto growth is coming from: it is not only cars but engines. Gas internal combustion engines and engine parts have quadrupled their share of exports since 2008. Medical exports, which have also increased their share of state exports, were led by not only medical instruments but also orthopedic goods and pharmaceuticals. We can also see which sectors saw their share of foreign shipments reduced. In several instances, it was due to technological changes as much as anything. Exports of DVDs, video games, and printers each not only lost half or more of their share of Tennessee’s exports but also exported substantially less in 2014 than they had in 2008. Aluminum plating and boat exports were other sectors that declined sharply.
On one hand, we can’t say that the five years following the world’s financial crisis led to truly dramatic changes in the state’s export profile. But we see a continuing evolution in the state away from Europe and toward the NAFTA market and East Asia. We also see a rotation in exported goods toward automotive and medical products, although a variety of chemicals must be included as well. Perhaps the biggest trend is toward greater concentration both in markets and in exported goods. All that said, one has to wonder if the growing economic challenges in China and the emerging markets will undermine these trends.
For Tennessee, it’s fair to say the crash turned out to be more of an interruption of longer-term trends than a remaking of the state’s export picture. Yet, having survived the crash, state exporters now have to face what many believe will be a persistent global economic slowdown. How might that remake Tennessee’s export profile?

